Every successful project requires clear visibility into its progress, completed activities, schedules, resources, procurement, risks, and future plans.
One of the most important documents used in project management is the Project Progress Report.
A project progress report helps stakeholders such as:
Project Managers
Engineers
Supervisors
Procurement Teams
Finance Teams
Management
Clients
understand the current condition of a project through structured and documented information.
Instead of relying on scattered spreadsheets and manual updates, companies can use digital project workflows such as Farinotech SaaS to connect project data from BOQ, Work Orders, Purchase Requests, Purchase Orders, Delivery Notes, Invoices, and operational activities into one reporting process.
What Is a Project Progress Report?
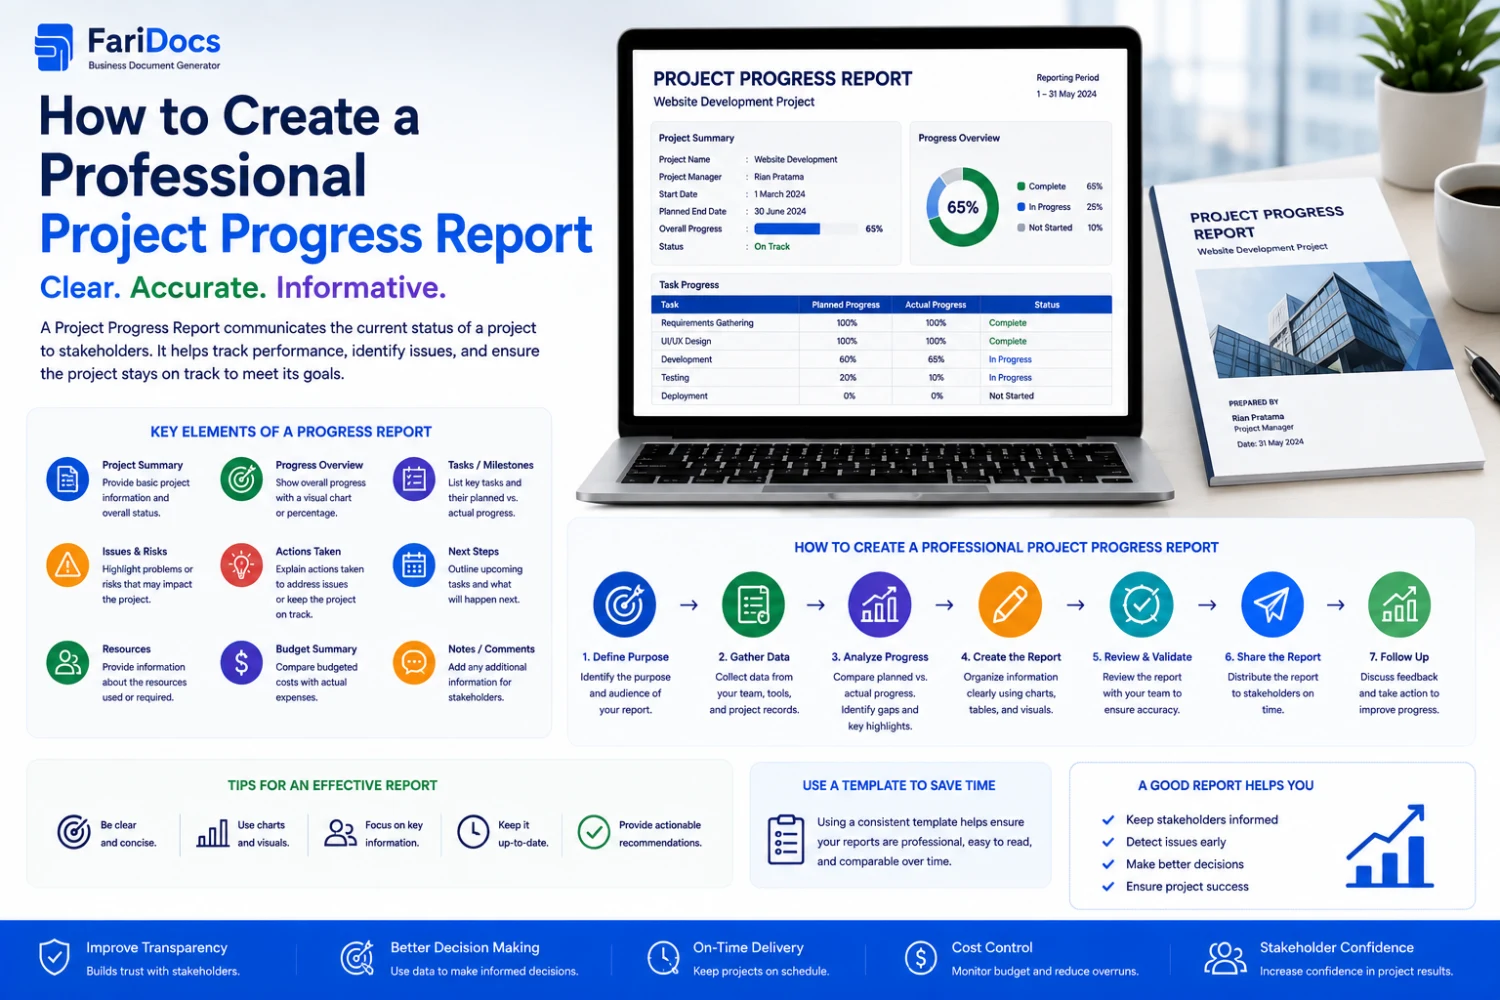
A Project Progress Report is a structured document that summarizes the development, status, achievements, challenges, and overall progress of a project during a specific reporting period.
It usually compares:
Planned work
Actual work completed
Project schedule
Progress percentage
Resource utilization
Procurement status
Issues
Risks
Corrective actions
Next activities
Progress reports may be created:
Daily
Weekly
Monthly
Per milestone
Based on company requirements
The purpose is to provide an accurate overview of project performance.
Why Is a Project Progress Report Important?
A professional progress report provides significant benefits for businesses and project teams.
1. Monitor Project Progress
Progress reports help compare planned and actual performance.
Example:
Activity
Planned
Actual
Foundation
100%
100%
Structure
80%
75%
Electrical
40%
35%
Plumbing
30%
30%
Stakeholders can quickly identify delayed activities.
2. Improve Decision Making
Project data helps managers make informed decisions.
Examples include:
Adding manpower
Adjusting schedules
Accelerating procurement
Changing suppliers
Increasing work shifts
Reallocating resources
Decisions become more data-driven rather than assumption-based.
3. Improve Client Communication
Clients often need regular updates without visiting the project site.
A progress report can include:
Work progress
Progress percentage
Photos
Schedule
Issues
Future plans
This creates more transparent communication.
4. Monitor Project Budget
Progress reports can also summarize financial information.
Example:
Item
Budget
Actual
Materials
IDR 500 Million
IDR 470 Million
Labor
IDR 300 Million
IDR 285 Million
Equipment
IDR 150 Million
IDR 140 Million
This helps management monitor project spending.
5. Create Historical Documentation
Every reporting period becomes part of the project's historical record.
This is useful for:
Project evaluation
Internal reviews
Audits
Client reporting
Lessons learned
Who Creates a Project Progress Report?
Depending on the organization, multiple teams may contribute.
Role
Responsibility
Project Manager
Final report preparation
Site Engineer
Technical progress
Supervisor
Site activity reporting
Quantity Surveyor
Quantity progress
Procurement Team
Material status
Finance
Cost information
QA/QC
Quality updates
Contractor
Work execution progress
Digital systems make it easier to consolidate information from different departments.
When Should a Progress Report Be Created?
The reporting frequency depends on the project.
Daily Progress Report
Used for projects requiring daily operational monitoring.
Usually includes:
Daily activities
Weather
Manpower
Equipment
Materials received
Site issues
Photos
Weekly Progress Report
Summarizes activities completed during one week.
Often shared with:
Project Managers
Clients
Management
Monthly Progress Report
Provides a broader strategic overview.
Usually includes:
Overall progress
Schedule analysis
Procurement
Financial progress
Risks
Quality
Safety
Planning
Milestone Progress Report
Created when major project milestones are completed.
Examples:
Foundation completed
Structure completed
Roofing completed
Finishing completed
Project handover
Essential Components of a Professional Progress Report
A professional report should follow a consistent structure.
1. Project Information
Example:
Field
Information
Project Name
Office Building Project
Project Number
PRJ-2026-001
Client
ABC Indonesia
Project Manager
John Doe
Reporting Period
August 1–31, 2026
2. Executive Summary
The executive summary provides a quick overview.
Example:
During August 2026, the project achieved 68% actual progress compared to the planned 70%. The 2% variance was mainly caused by delayed electrical cable delivery. Structural work continued according to schedule, while the procurement team coordinated expedited delivery to support recovery activities planned for early September.
This section is often the first part read by management.
Example:
Description
Progress
Planned Progress
70%
Actual Progress
68%
Variance
-2%
Variance indicates the difference between planned and actual progress.
4. Detailed Work Progress
Work Item
Planned
Actual
Status
Foundation
100%
100%
Completed
Structural Work
80%
75%
In Progress
Electrical
50%
45%
In Progress
Plumbing
40%
40%
On Schedule
Painting
10%
5%
Started
5. Schedule Progress
Compare planned and actual schedules.
Activity
Planned Finish
Status
Foundation
Aug 10
Completed
Structure
Aug 20
In Progress
Electrical
Aug 28
Delayed
Plumbing
Aug 30
On Schedule
When delays occur, clearly explain the reason.
6. Procurement Progress
Material availability often affects project progress.
Example:
Material
Required
Ordered
Received
Cement
500 Bags
500
500
Steel
10 Tons
10
8
Cable
5,000 m
5,000
3,500
Pipe
2,000 m
2,000
2,000
These figures can be connected to Purchase Orders and Delivery Notes within a digital procurement workflow.
7. Manpower Report
Position
Quantity
Engineers
5
Supervisors
8
Technicians
20
Labor
65
Total
98
Manpower data supports productivity analysis.
8. Equipment Report
Equipment
Status
Excavator
Operational
Crane
Operational
Concrete Mixer
Maintenance
Generator
Operational
Equipment availability should be monitored throughout the project.
9. Issues and Challenges
Example:
Issue
Impact
Corrective Action
Cable Delivery Delay
Electrical delayed
Supplier escalation
Heavy Rain
Outdoor work interrupted
Schedule adjustment
Limited Workforce
Productivity reduced
Additional manpower
A professional report explains both the problem and the response.
10. Risk Monitoring
Risk refers to potential future problems rather than existing issues.
Example:
Risk
Probability
Mitigation
Material shortage
Medium
Maintain safety stock
Rain season
High
Schedule buffer
Supplier delay
Medium
Alternative supplier
11. Quality Progress
Quality information may include:
Inspection results
Quality checklist
NCR status
Corrective action
QA/QC approval
Example:
Inspection
Result
Concrete Test
Passed
Cable Installation
Passed